
Originally posted by MrMarkyMark
View Post
- Visitors can check out the Forum FAQ by clicking this link. You have to register before you can post: click the REGISTER link above to proceed. To start viewing messages, select the forum that you want to visit from the selection below. View our Forum Privacy Policy.
- Want to receive the latest contracting news and advice straight to your inbox? Sign up to the ContractorUK newsletter here. Every sign up will also be entered into a draw to WIN £100 Amazon vouchers!
Help needed - Kick ass graphic idea needed
Collapse
X
-
No need, he can draw it on his gut. Loadsa room there. And with some judicious flab folding, the relationships could be clearly illustrated. -
Data tattooOriginally posted by barrydidit View PostNo need, he can draw it on his gut. Loadsa room there. And with some judicious flab folding, the relationships could be clearly illustrated.
Comment
-
a MOOB graph?Originally posted by barrydidit View PostNo need, he can draw it on his gut. Loadsa room there. And with some judicious flab folding, the relationships could be clearly illustrated.Comment
-
All these suggestions and not one of you have asked about the day rate. You make me sick.The greatest trick the devil ever pulled was convincing the world that he didn't existComment
-
Stop trying to do it in one chart. Instead, you should rank the products by popularity, and then show the connections between those products and all other products, iterating through in separate charts, as necessary. You need to show conditional information, rather than joint information. If there are important connections in groups (e.g. how A and B together are connected to all others separately), you can show that in a conditional chart too, depending on what is necessary to support your analysis. That way, you can summarise any important connections in words, and point to specific charts (e.g. in an appendix to the main presentation/document) to show the inter-connectivity when questioned. Even if there were a chart that could visually depict what you want, the volume of information would obscure any analysis you were trying to emphasise.Comment
-
Hence why I tried to point him to Stephen Few, a specialist in visualisations.Originally posted by jamesbrown View PostStop trying to do it in one chart. Instead, you should rank the products by popularity, and then show the connections between those products and all other products, iterating through in separate charts, as necessary. You need to show conditional information, rather than joint information. If there are important connections in groups (e.g. how A and B together are connected to all others separately), you can show that in a conditional chart too, depending on what is necessary to support your analysis. That way, you can summarise any important connections in words, and point to specific charts (e.g. in an appendix to the main presentation/document) to show the inter-connectivity when questioned. Even if there were a chart that could visually depict what you want, the volume of information would obscure any analysis you were trying to emphasise.The Chunt of Chunts.Comment
-
Yeah Stephen More and Joseph Tonnes are not the solution.Originally posted by MrMarkyMark View PostHence why I tried to point him to Stephen Few, a specialist in visualisations.Comment
-
LOLOriginally posted by PurpleGorilla View PostYeah Stephen More and Joseph Tonnes are not the solution.
https://www.perceptualedge.com/about.phpThe Chunt of Chunts.Comment
-
Seems like the simplest answer is some kind of tree diagram, with the most adopted product at the top, followed by the lesser adopted in order down the page/screen, somewhat like a family tree, with each pair joined by bars whose thickness is proportional to the sum of the prevalence of the group(s) that pair finds itself in.Originally posted by MarillionFan View PostIt'll look crap. You won't be able to read anything off the first 10/20 bubbles.
A, AB, AC, AD, AE, AF etc ABCDEFGHIJKLMNOP etc etc
Impossible to read.
So if A is the most adopted and B the second most, what's the best graphic.
But you'll have to be selective, and maybe include only the top ten lines at most. If you really want something flash, you could have an interactive SVG image where they can click on individual products and see just these "pair bars" going from that product to the others. For a small fee I might be able to whump up something like that this weekend.
Oh and in theory there's a shed load more than 144 possible combinations - You're talking factorials!Work in the public sector? Read the IR35 FAQ hereComment
-
Originally posted by MrMarkyMark View PostHence why I tried to point him to Stephen Few, a specialist in visualisations.
Wasn't overly impressed with his site.
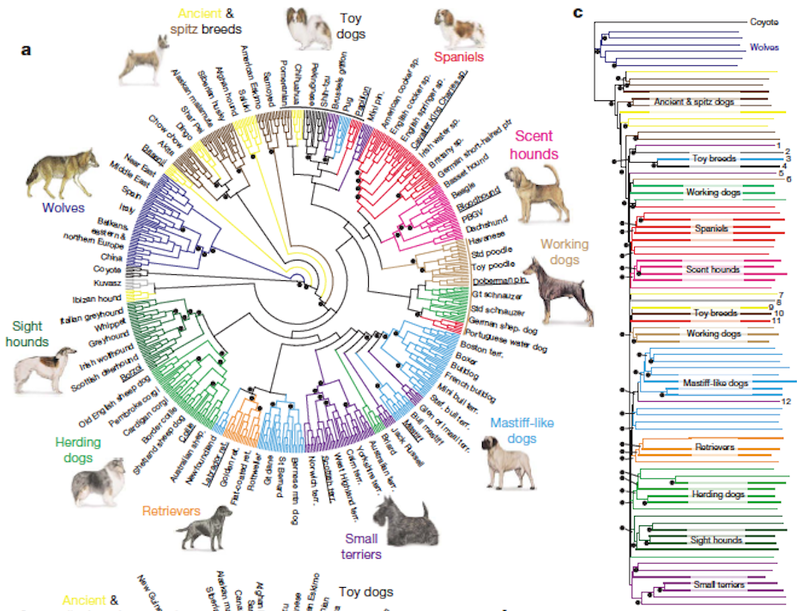
Someone has recommended a Dendrogram. I quite like it, especially this one. Looks like Fat Lazy Contractors family tree
What happens in General, stays in General.You know what they say about assumptions!Comment
- Home
- News & Features
- First Timers
- IR35 / S660 / BN66
- Employee Benefit Trusts
- Agency Workers Regulations
- MSC Legislation
- Limited Companies
- Dividends
- Umbrella Company
- VAT / Flat Rate VAT
- Job News & Guides
- Money News & Guides
- Guide to Contracts
- Successful Contracting
- Contracting Overseas
- Contractor Calculators
- MVL
- Contractor Expenses
Advertisers
Contractor Services
CUK News
- HMRC standstill agreements extended to 72 months: why the term's doubled, and what to check before signing Today 05:53
- Who owns the loans? Inside the mystery of the loan charge recall scandal Yesterday 06:20
- Umbrella company winding-up petitions in 2026: the practical guide for contractors Jul 29 05:29
- Payments on Account deadline: what contractors must do before July 31st — maybe for the final few times Jul 28 08:01
- Andy Burnham's first 100 days: five things contractors need from the new PM Jul 27 00:53
- Starmer vs Burnham on housing: What their rival plans mean for your contractor mortgage Jul 22 00:59
- Burnham's housing vision vs. Starmer's home-buying reforms: what it means for your contractor mortgage Jul 22 00:59
- In Khalil v Innovate Transport, a limited company contractor wasn’t a worker and was on £2.30 — not £230 Jul 21 07:58
- Andy Burnham is PM: 5 new IT policies set to shape UK tech and its contractors Jul 20 06:29
- Taxed on money I haven't earned yet? Bold move, HMRC Jul 17 08:36


Comment