• Visitors can check out the Forum FAQ by clicking this link. You have to register before you can post: click the REGISTER link above to proceed. To start viewing messages, select the forum that you want to visit from the selection below. View our Forum Privacy Policy.
  • Want to receive the latest contracting news and advice straight to your inbox? Sign up to the ContractorUK newsletter here. Every sign up will also be entered into a draw to WIN £100 Amazon vouchers!

Letters to a Heretic

Collapse
X
  •  
  • Filter
  • Time
  • Show
Clear All
new posts

    #41
    Of course we keep hearing there's going to be more droughts, hurricanes etc, but so far there is no discernible trend. Global precipitation levels measured by satellites haven't changed (if they had it would have been headline news). Some climate scientists claimed there were more hurricanes, but the statistics over the last 100 years, show no trend whatsoever, and there was a huge row about it as the hurricane experts said it was codswollop. Then they said the snow would disappear, and then they said the snow would come back again. Sea levels are basically rising at the snails pace level they've been rising since 17th century. The south pole has got slightly cooler. The only thing left in the basket of "evidence" is a bit of ice missing in the Arctic during September compared to 30 years ago, even the idea of a "tipping point" in the Arctic was thrown on the scrap heap recently.

    Of course assuming the warming continues (which would be a change, because the globe stopped warming about a decade ago), why should dry places get drier and wet places get wetter? Judith Curry the climate scientist hit the nail on the head when she said "they don't know" some places will get worse some places will get better. According to the "theory" it's the temperate zones and the poles that are supposed to be most affected, not the tropical countries. Of course the scientists love to paint a picture of disaster. Fact is agricultural yields have been going up over the last 30 years.
    Last edited by BlasterBates; 1 March 2011, 12:22.
    I'm alright Jack

    Comment


      #42
      Originally posted by BlasterBates View Post
      Of course we keep hearing there's going to be more droughts, hurricanes etc, but so far there is no discernible trend. Global precipitation levels measured by satellites haven't changed (if they had it would have been headline news). Some climate scientists claimed there were more hurricanes, but the statistics over the last 100 years, show no trend whatsoever, and there was a huge row about it as the hurricane experts said it was codswollop. Then they said the snow would disappear, and then they said the snow would come back again. Sea levels are basically rising at the snails pace level they've been rising since 17th century. The south pole has got slightly cooler. The only thing left in the basket of "evidence" is a bit of ice missing in the Arctic during September compared to 30 years ago, even the idea of a "tipping point" in the Arctic was thrown on the scrap heap recently.

      Of course assuming the warming continues (which would be a change, because the globe stopped warming about a decade ago), why should dry places get drier and wet places get wetter? Judith Curry the climate scientist hit the nail on the head when she said "they don't know" some places will get worse some places will get better. According to the "theory" it's the temperate zones and the poles that are supposed to be most affected, not the tropical countries. Of course the scientists love to paint a picture of disaster. Fact is agricultural yields have been going up over the last 30 years.
      Yes but don't go getting too complacent BB. There are legions of compliant little numbercrunchers like sasguru beavering away to produce computer models and flawed statistics that will blow this whole evidence-based rationale out of what is left of the water!!

      “The period of the disintegration of the European Union has begun. And the first vessel to have departed is Britain”

      Comment


        #43
        Jeremy Clarkson drove a big car from Canada to the north pole last summer.

        I hope he didn't drown.

        Comment


          #44
          Originally posted by shaunbhoy View Post
          Yes but don't go getting too complacent BB. There are legions of compliant little numbercrunchers like sasguru beavering away to produce computer models and flawed statistics that will blow this whole evidence-based rationale out of what is left of the water!!

          You're just one of those bitter little men who weren't overly gifted in life's lottery, aren't you?
          Thing is no one is really going to pay a lot of notice to your opinions, you're not one of life's movers and shakers, so just give it a rest and try to pay off your overdraft every month, there's a good chap.

          HTH
          Hard Brexit now!
          #prayfornodeal

          Comment


            #45
            Does that graph start in the carefully selected date of 1980? The truth is, ice comes and goes all through history.

            Ice at the North Pole in 1958 and 1959 – not so thick
            What would NSIDC and our media make of a photo like this if released by the NAVY today? Would we see headlines like “NORTH POLE NOW OPEN WATER”? Or maybe “Global warming melts North Pole”? Perhaps we would. sensationalism is all the rage these days. If it melts it makes headlines.


            It was that way again in 1962:


            And again in 1987:


            But contrast that to thick ice again in 1999:


            I can extrapolate a decent upturned hockey stick from those pictures.

            Comment


              #46
              Originally posted by sasguru View Post
              The usual frustrated pointless small man drivel.............
              Back to those models numpty. And if you can't produce me a decent hockeystick graph before close of play then don't bother coming into tomorrow.

              “The period of the disintegration of the European Union has begun. And the first vessel to have departed is Britain”

              Comment


                #47
                Can anyone here see a trend?


                The usual "codswallop" Global warming caused the Queensland floods. One question would be, what caused the Queensland floods in the last century? Second question if there was flooding in the past would you expect flooding to reoccur? and finally if you did expect it to reoccur how do you differentiate a Queensland flood caused by Global Warming from one not caused by Global Warming?
                Last edited by BlasterBates; 1 March 2011, 16:02.
                I'm alright Jack

                Comment


                  #48
                  A graph covering 9 years? How very informative.
                  Originally posted by MaryPoppins
                  I'd still not breastfeed a nazi
                  Originally posted by vetran
                  Urine is quite nourishing

                  Comment


                    #49
                    Originally posted by d000hg View Post
                    A graph covering 9 years? How very informative.
                    Yes, exactly, indeed it is.

                    These are anomalies with respect to the last 30 years of data, i.e. rain fall in the last 9 years has been around average of the last 30 years rainfall.

                    That means no trend for 30 years.
                    Last edited by BlasterBates; 1 March 2011, 16:45.
                    I'm alright Jack

                    Comment


                      #50
                      Does that graph start in the carefully selected date of 1980?
                      As I wrote, it covers the period since satellites were launched in 1979; measurements before then being less certain, for obvious reasons. But we don' want your steenkin' satellites with their millions of data points - we got four photos showing one point on one day - I think the implications are obvious. As somebody wrote once.

                      Data prior to the satellite era was analysed in Polyak et al 2010 and they found

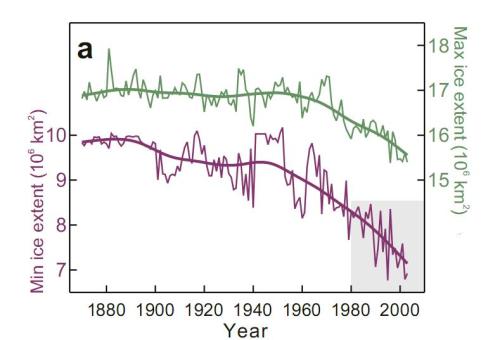
                      The current reduction in Arctic ice cover started in the late 19th century, consistent with the rapidly warming climate, and became very pronounced over the last three decades. This ice loss appears to be unmatched over at least the last few thousand years and unexplainable by any of the known natural variabilities.
                      This is the data from the last 100 years or so showing max summer and winter extent
                      My subconscious is annoying. It's got a mind of its own.

                      Comment

                      Working...
                      X