Visitors can check out the Forum FAQ by clicking this link. You have to register before you can post: click the REGISTER link above to proceed. To start viewing messages, select the forum that you want to visit from the selection below. View our Forum Privacy Policy.
Want to receive the latest contracting news and advice straight to your inbox? Sign up to the ContractorUK newsletter here. Every sign up will also be entered into a draw to WIN £100 Amazon vouchers!
You are not logged in or you do not have permission to access this page. This could be due to one of several reasons:
You are not logged in. If you are already registered, fill in the form below to log in, or follow the "Sign Up" link to register a new account.
You may not have sufficient privileges to access this page. Are you trying to edit someone else's post, access administrative features or some other privileged system?
If you are trying to post, the administrator may have disabled your account, or it may be awaiting activation.
I've been looking at the rental market with half an eye as in about a years time I am going to be looking at a decision as to either sell or let out my house when it becomes vacant.
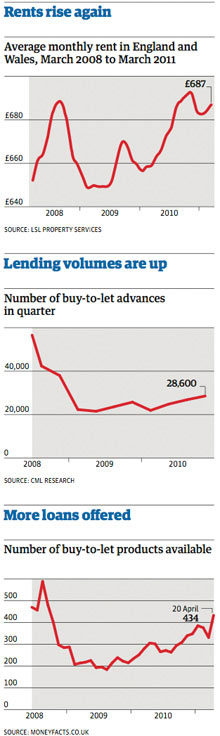
So in 2008 or 3 years ago at lowest point of rents they were £650 and now they are pushing £680 (like it happened before so they are just returning to previous levels), but even taking these 2 numbers we can see £30 inflation over 3 years of £10 per year on 650 base or 1.5% per annum. Big deal - my car refuel gone up by far more than that every time I refuel (luckily only once a month due to close proximity of work).
See, nothing scary but whoever created that chart sure made the usual effort of misprepresenting data by not using chart with 0 base - in a very few rare cases when it is justified that person should keep their jobs, in all others - fired.
 sob
sob
Leave a comment: