Visitors can check out the Forum FAQ by clicking this link. You have to register before you can post: click the REGISTER link above to proceed. To start viewing messages, select the forum that you want to visit from the selection below. View our Forum Privacy Policy.
Want to receive the latest contracting news and advice straight to your inbox? Sign up to the ContractorUK newsletter here. Every sign up will also be entered into a draw to WIN £100 Amazon vouchers!
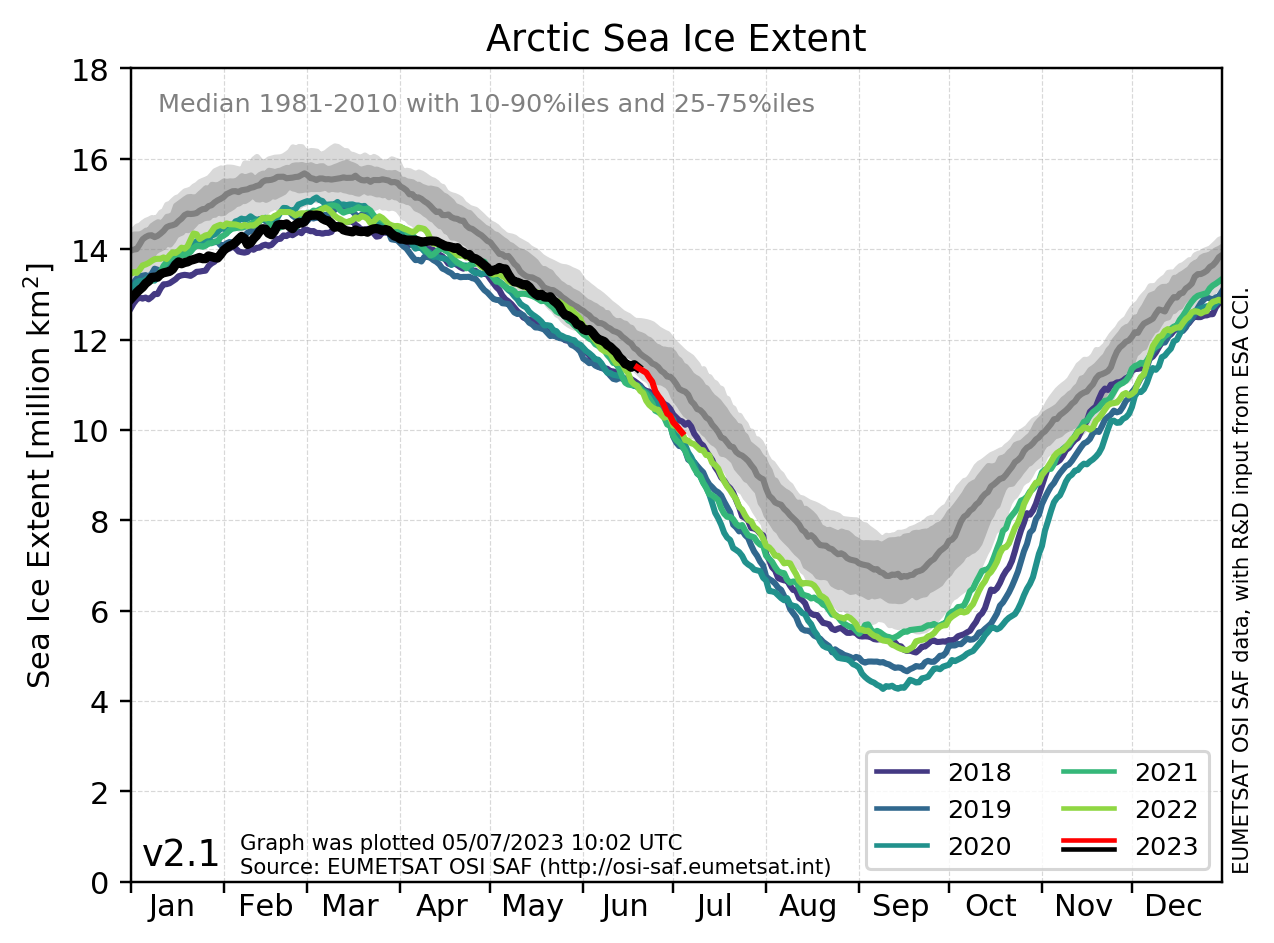
Yep, loadsa graphs out there. That one is showing this years ice well below the long term mean, and by eyeball already outside the grey 1 standard deviation band.
My subconscious is annoying. It's got a mind of its own.
Yep, loadsa graphs out there. That one is showing this years ice well below the long term mean, and by eyeball already outside the grey 1 standard deviation band.
It's actually in the grey, you might want to get your eyes tested.
"Eyeballing" isn't a very scientific way of analysing data, so I would suggest some elementary reading. You might find it helpful.
the arctic was supposed to be ice-free by now, yet there are ships getting stuck in the ice. just like last year when we had a grand expedition to Antartica to show the devastating effects of global warming
what happened ? it got stuck in the ice and they had to be helicoptered off
(\__/)
(>'.'<)
("")("") Born to Drink. Forced to Work
Eyeballing is often enough - just means I CBA to dig any deeper than looking at the graph, thanks for the correction, if it is not outside the 1sd range yet, it soon will be.


Comment